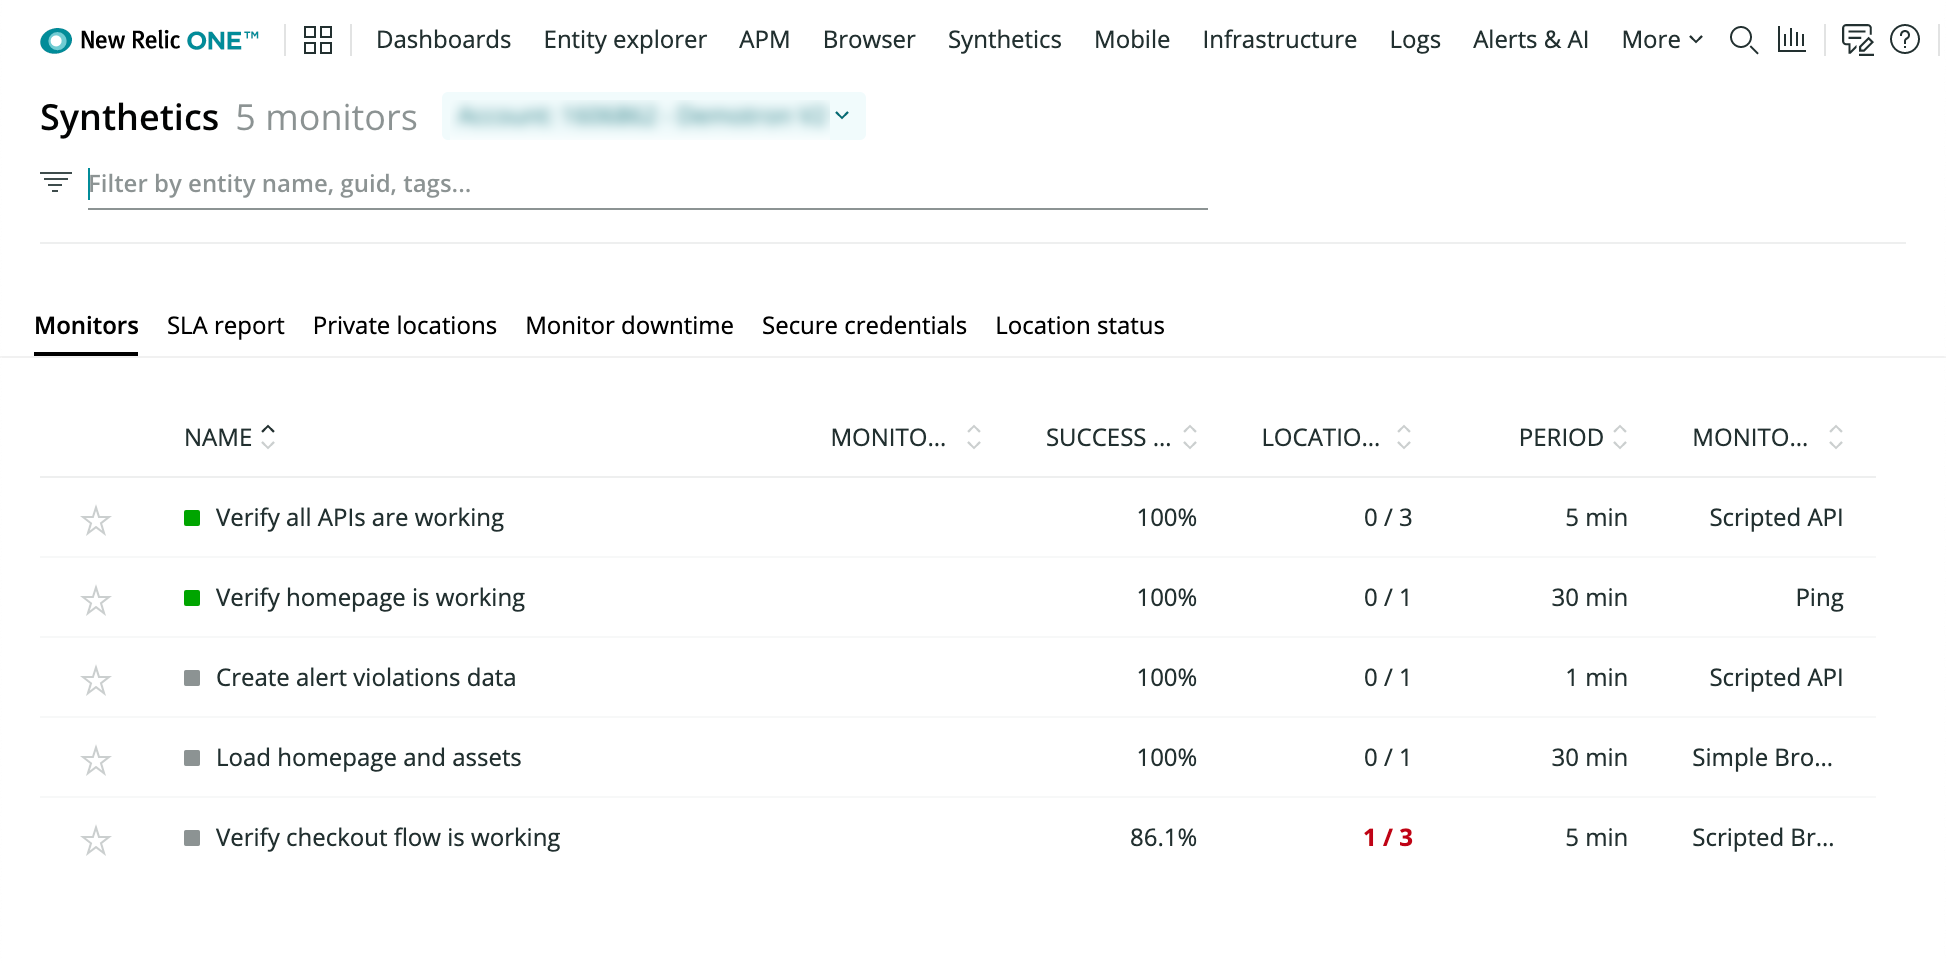
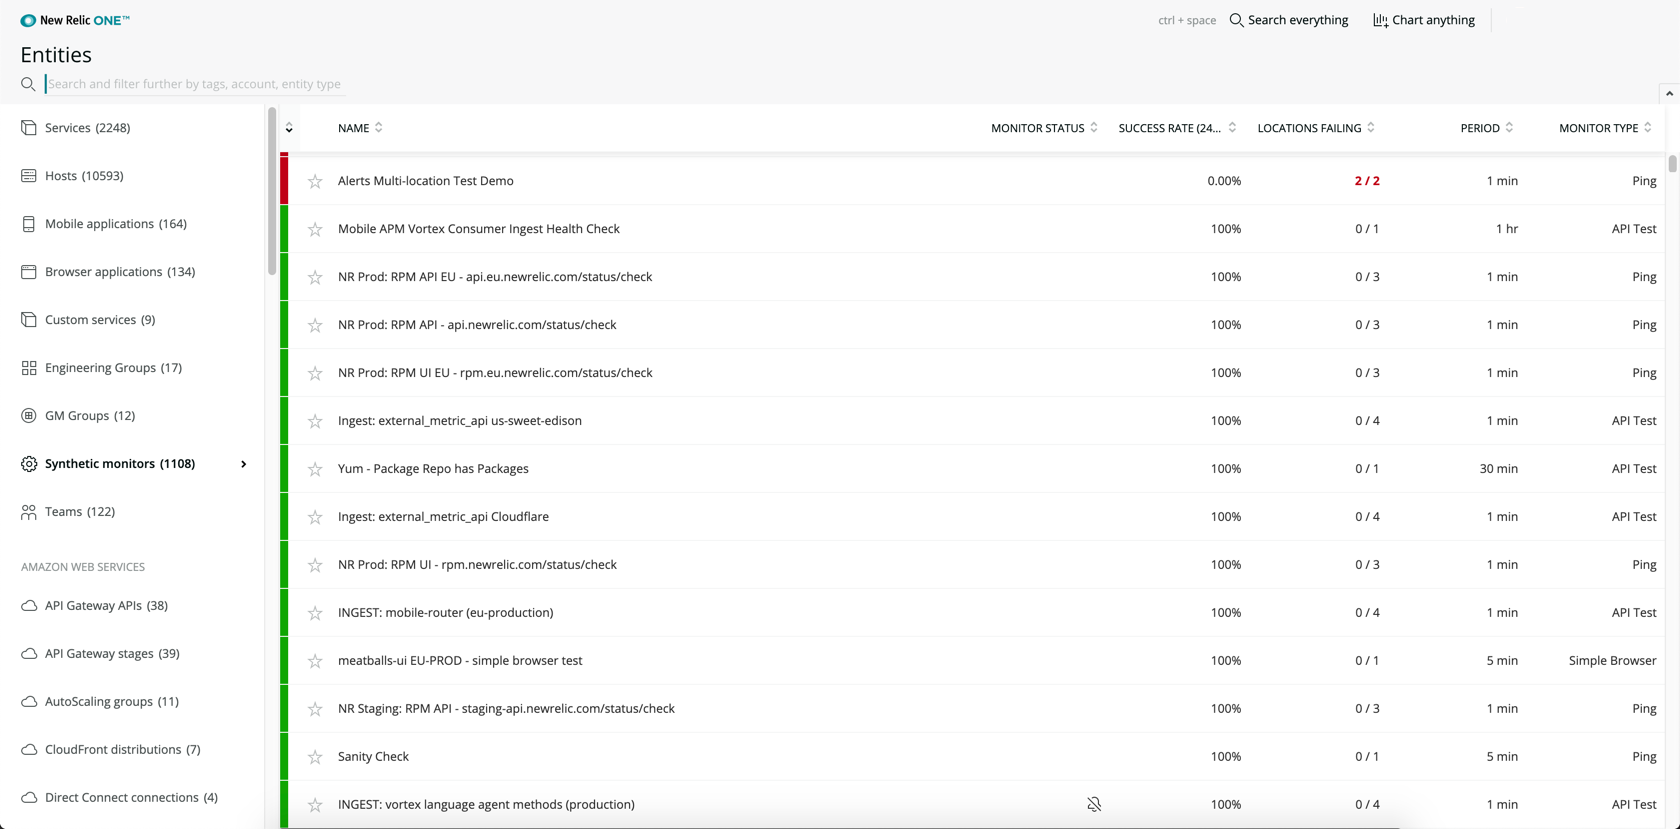
In our synthetic monitoring tool, the monitors index lists all monitors associated with your New Relic account, and gives you a quick snapshot of each monitor's performance over the last 24 hours. Select an individual monitor to view a Summary page and get a deeper insight into its performance over time. Or, filter the list to quickly compare the performance of similar monitors.
View the monitors index
To access an index (or list) of your monitors, go to one.newrelic.com > Explorer > Synthetic monitors. Use the Explorer to access all your entities, that is, anything we can identify that reports data, from synthetic monitors to applications, hosts, or custom groupings of any elements.
Alternatively, you can go to one.newrelic.com > Synthetics.

You can check the status and main metrics of your synthetic monitors at a glance thanks to the Monitors index.
You can also use the explorer to view a list of all monitors associated with your New Relic account, along with a quick snapshot of each monitor's performance. To access an index (or list) of your monitors: Go to one.newrelic.com > Explorer > Synthetic monitors.

one.newrelic.com > Explorer > Synthetic monitors: Use the monitors index to access any of your Synthetics monitors, and to view a quick snapshot of their performance.
Understand monitor metrics
Use the monitors index to access your monitors and view a quick snapshot of monitor performance. The index includes the following metrics:
- Alert status: Indicates the status of any alerts on the monitor:
- Green: No open violations
- Red: Critical violation in progress
- Grey: No alert conditions defined with alerts
- Monitor status: Indicates a status has been applied to the monitor, such as Mute or Disabled.
- Success rate: The percentage of monitor checks that end in success. A multi-step monitor that does not complete all steps is considered a failure.
- Locations failing: The number of locations that have failed during the given timeframe.
- Period: How often the monitor checks run.
- Monitor type: The selected monitor type.
Use index functions
The monitors index supports the following features:
If you want to... | Do this... |
|---|---|
Sort the monitor list | Select a column label to sort the list based on that metric. Select the label again to change the sort order from ascending to descending. |
Filter the monitor list | Type your keyword in the search box to filter by name, tags, or entitiy type. |
Add to favorites | To favorite a monitor, select the star star icon icon. Favorite monitors appear at the top of the monitor list. To remove a monitor from your favorites, select the star icon again. |